The early weeks of the pandemic outbreak were marked by a spike in orders from retailers amid widespread public concern that supplies would dry up. Following that early spike, we saw a decline in purchasing across all major industries – including food and beverage, manufacturing, CPG and retail – which bottomed out in mid-April.
As the shopping frenzy has slowed and congestion at facilities has let up, operators have had a chance to reset, adjust to the new normal and create efficiencies at the site level. This includes improving the check-in process, instituting measures to ensure social distancing/driver safety, and using technology to manage critical appointments and enhance collaboration between carriers, drivers and vendors. Due, in large part to these efforts, we’ve seen a marked decline in average dwell time across the country, as tracked by our live Network Congestion Map.
In recent weeks, we have seen that supply chains are improving, continuing the pattern we have tracked for the last month. In fact, we’re seeing that aggregate load volume across the country has increased almost 10% over last 4 weeks, and we have confidence that volume will continue its steady climb, though at what pace is very much uncertain – especially in light of US states beginning to lift shelter-in-place restrictions that were put in place in March.
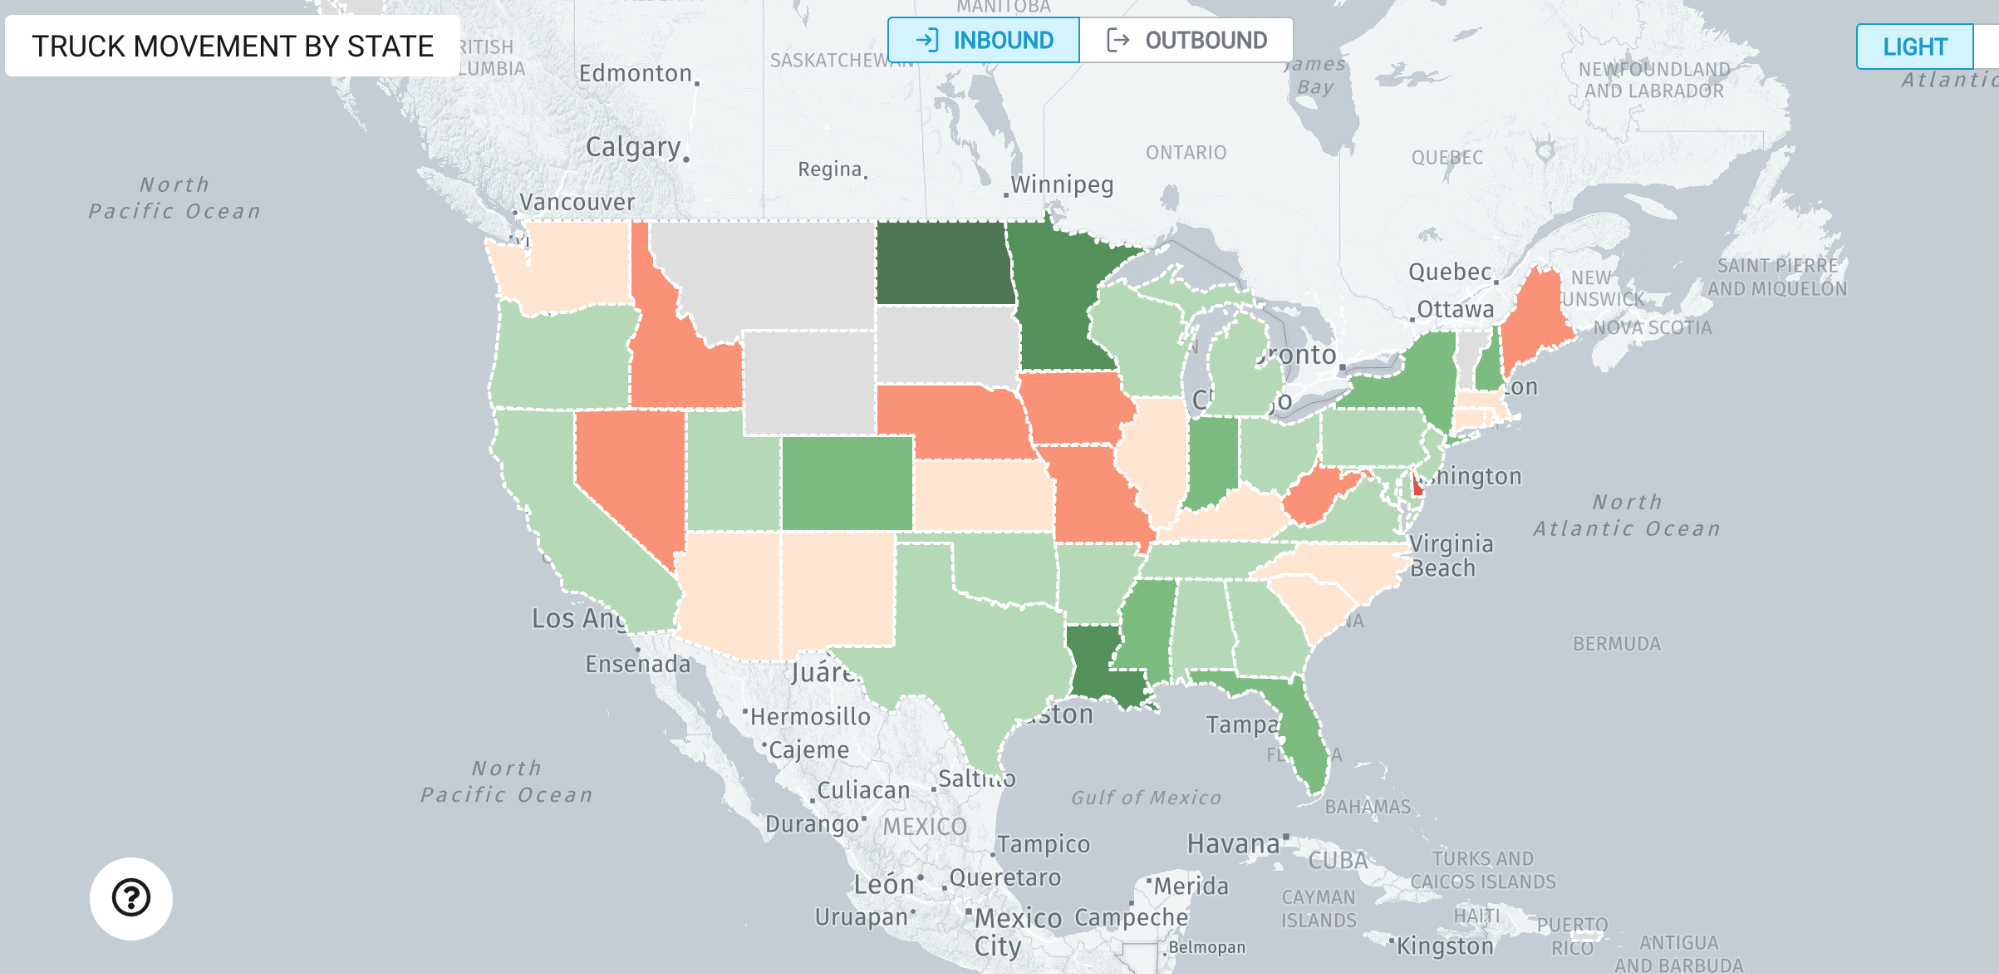
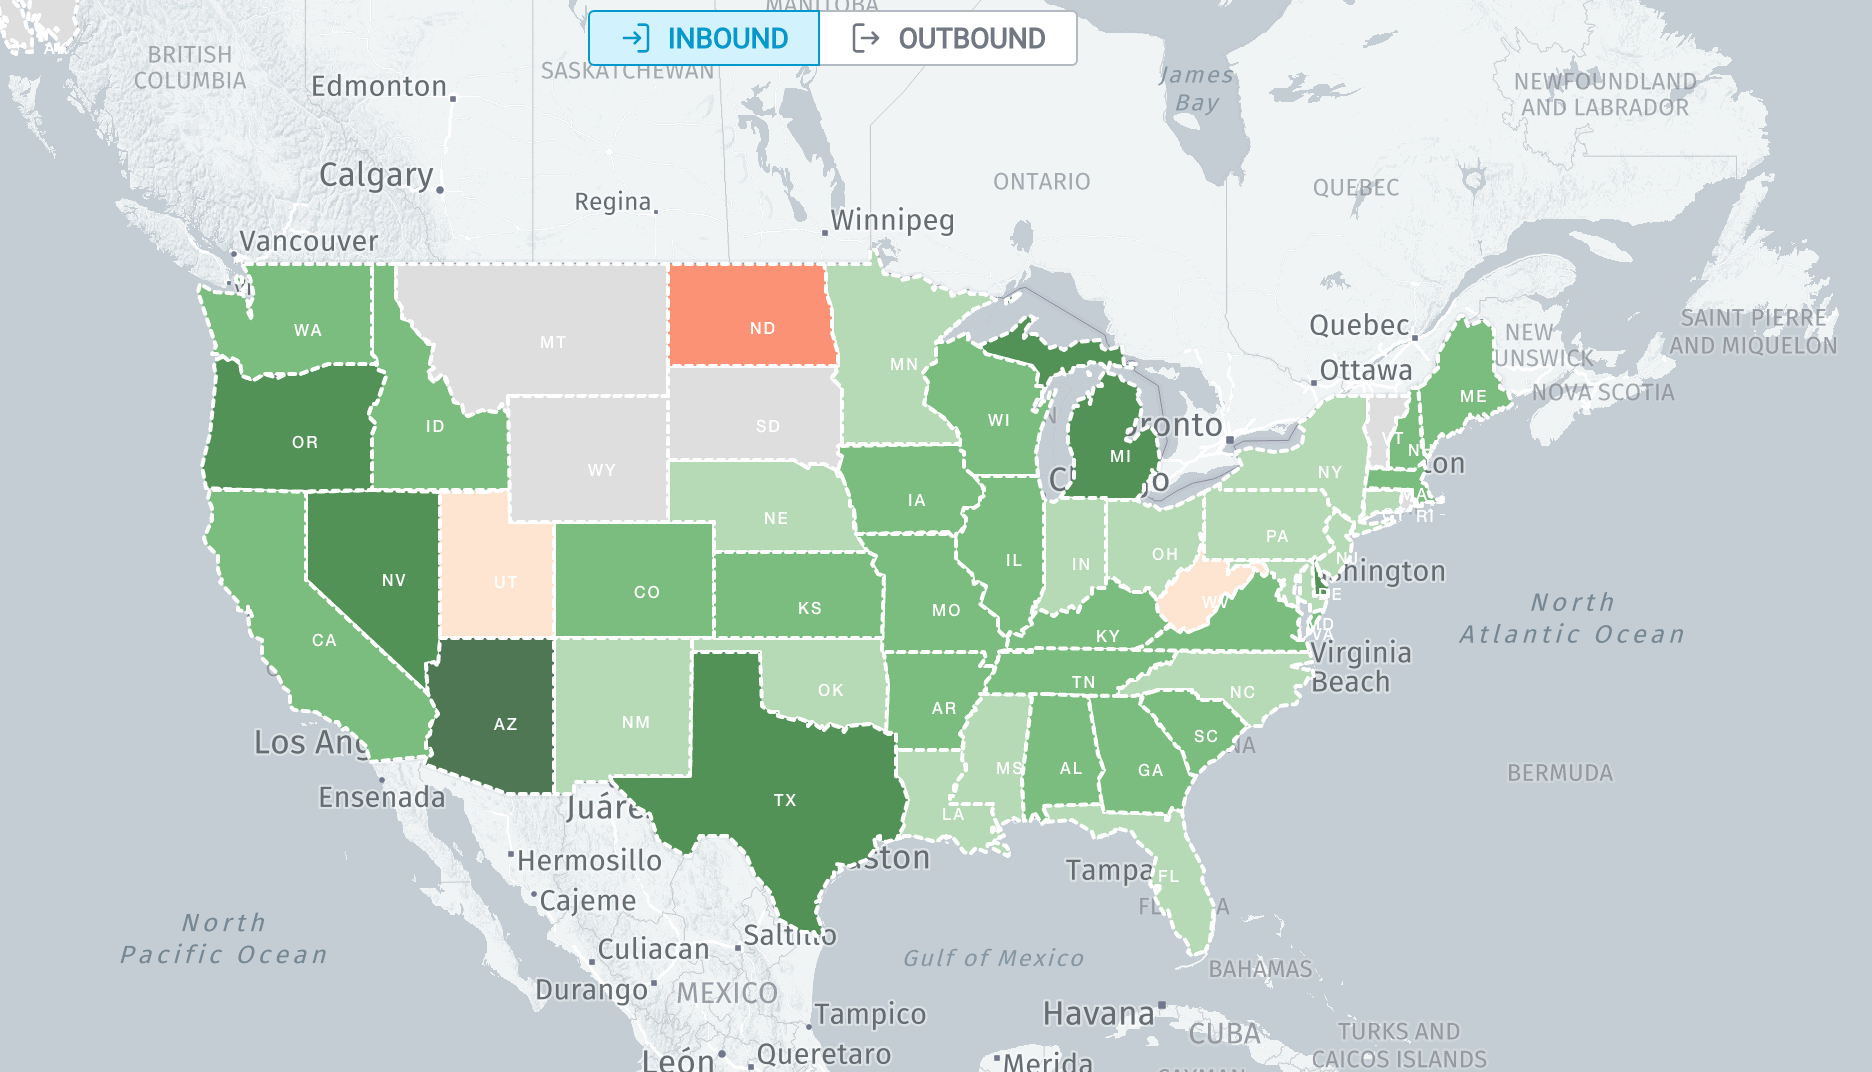
A time-lapsed view of the Network Congestion Map just over the last week shows a more green than red purview, indicating that goods are moving more freely than at any time over the last couple of months. (Values highlighted on the map are calculated by using last week’s volume divided by the average of the previous two weeks to even out any fluctuations.)
On May 6, we saw a significant part of the country seeing downward trends on their inbound loads:
Two weeks later, on May 22, that downward trend had stopped across the board, and the country as a whole was either flat-lining or seeing upward improvement in inbound load volume:
We then examined individual states and saw some interesting relationships between load volume and dwell times. Typiy, these two exhibit a positive correlation – a spike in load volume typiy results in longer waits at facilities and increased dwell times.
But if we’ve learned anything over the last couple of months, it’s that things are far from “typical”. Here are some of the latest trends that we’re observing when it comes to freight volume across the US:
This is quite an unusual relationship. In certain states with the highest-volume increases, we found a negative correlation with decreasing dwell times. In these states, which include California, Illinois and Iowa, dwell time decreased 10-20% (measured in minutes) as an average value across all facilities, indicating efficient management of traffic coming into warehouses and distribution centers. This is a significant improvement that helps both with overall costs and driver satisfaction.
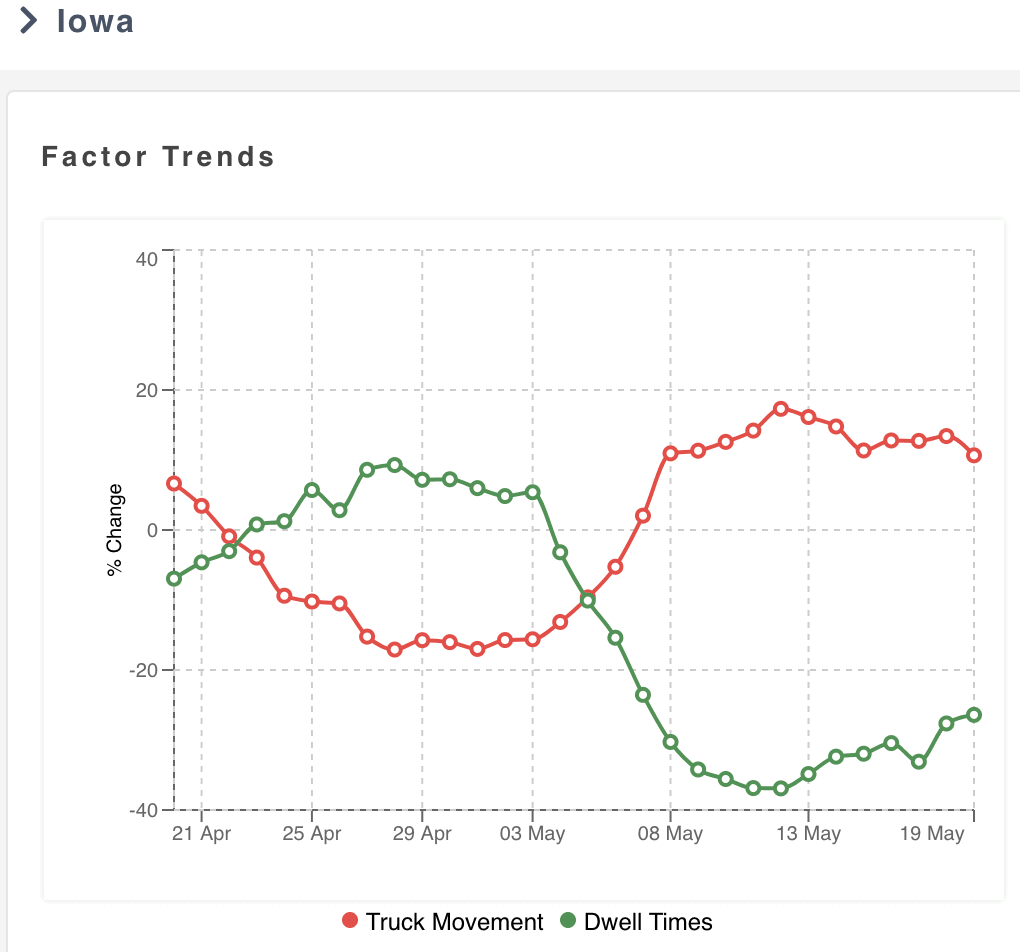 Iowa, for instance, has seen an increase in freight volume of ~20% since May 1, while dwell time has dropped by ~40% over the same period. We believe the likely reason for this is that while states were implementing a higher level of lockdown in the second half of April, there was an increase in wait times even with freight volumes declining. Now that volume is trending up and people are getting back to work, we are seeing irregularity in these traditional relationships, at least for the short term.
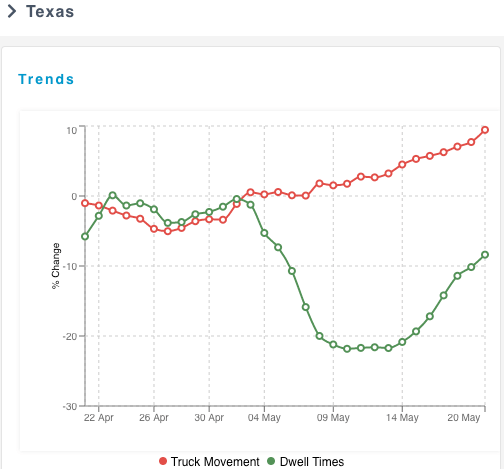 This is another unexpected trend. The fluctuations in dwell time in Texas have been more pronounced in the first few weeks of May after the lockdown was lifted. We believe this is related to additional load volume from loads previously categorized as “non-essential”, and companies instituting proper safety and hygiene processes, which likely added some time to each inbound load.
We see this pattern in other states as well, including Florida, New York, Ohio and Texas.
We compared data for both inbound and outbound freight, and found different patterns in dwell depending on what industry, lane and time you were hauling freight. For example in this snapshot of Georgia, we see no/low change in outbound dwell times – in the 5-10% range, which is quite normal – despite the surge in freight volume. This indicates that facilities in Georgia could be increasing their infrastructure and planning appointments to maximize efficiency and maintain consistent dwell times.
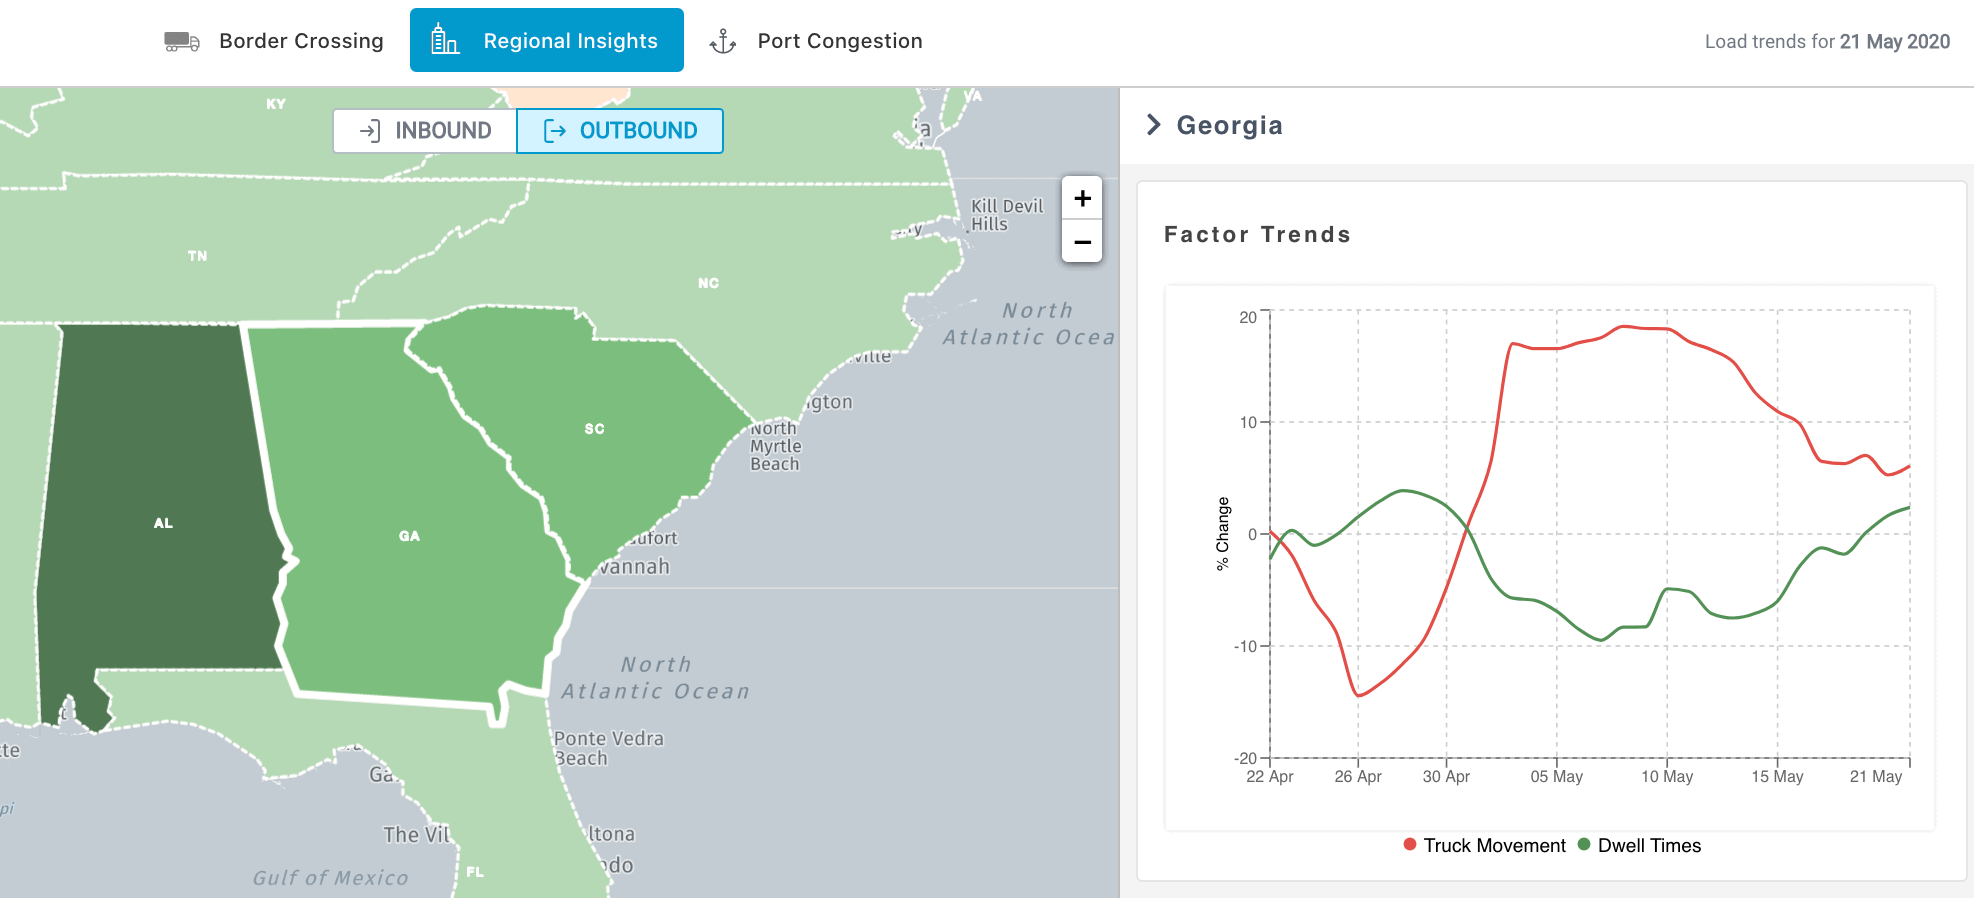
We see more variance, however, in Georgia’s inbound freight volume.
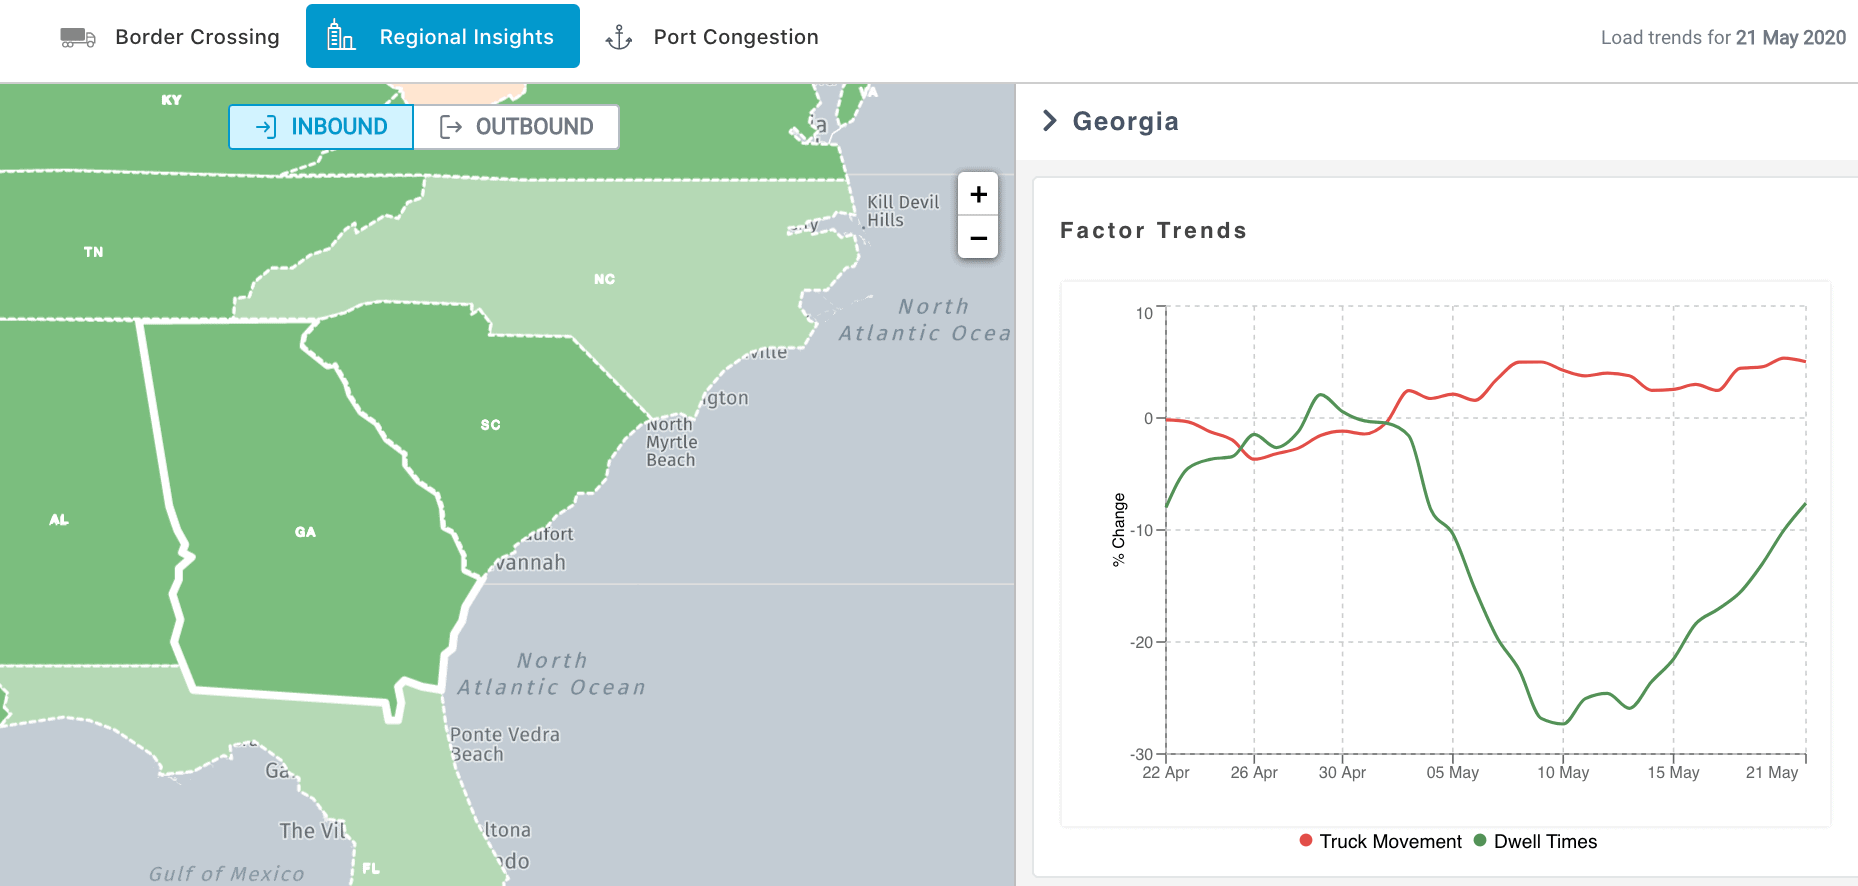
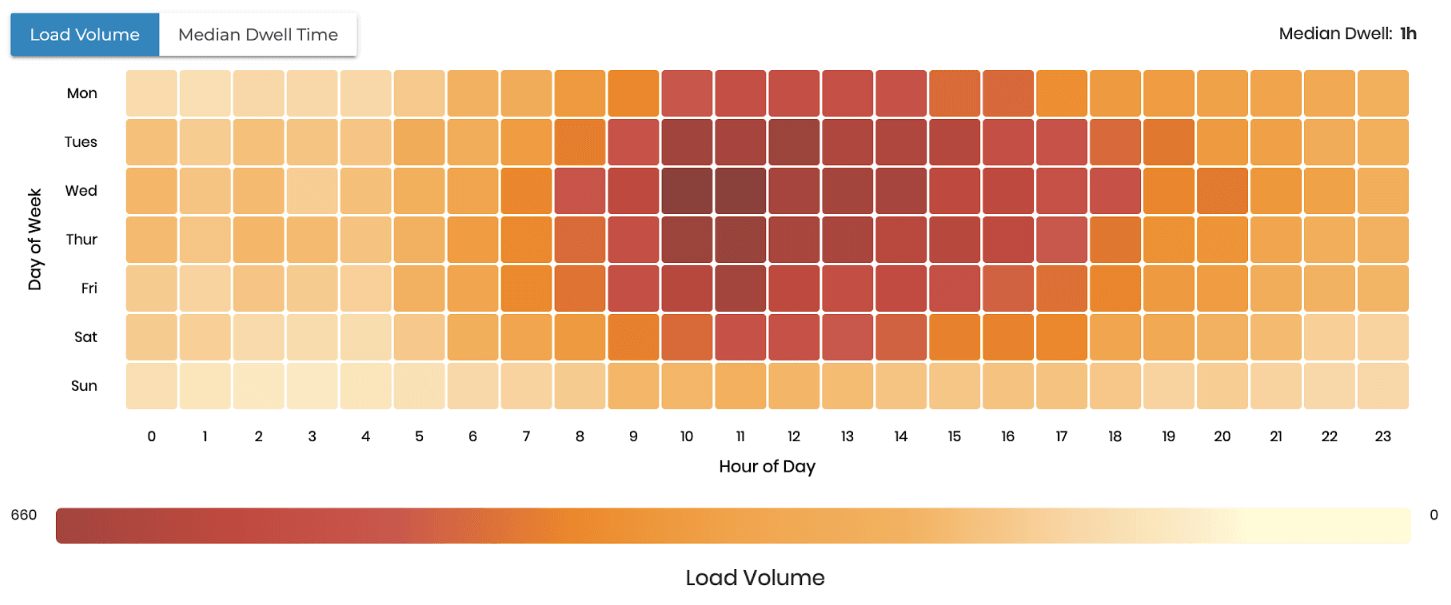
Similar variances between outbound and inbound trends are seen in Illinois, California and Pennsylvania. In order to bolster efforts to maintain consistent dwell times, we advise freight carriers and shippers to closely track facility data and to use a dwell score card to aid in appointment scheduling. Here is a snapshot of what that looks like in the FourKites platform. These are invaluable tools logistics professionals managing data-driven supply chains.
It’s difficult to predict the impact on freight volume and dwell time as states start opening up over the coming weeks and months. We estimate that we will see continued marginal increases within CPG, F&B and retail. In contrast, the heavy industrial sector is still mired by a lot of uncertainty, especially in the automotive sector – which will likely last at least until the third quarter. We will keep a close watch on these as we progress.
You can get a detailed picture of what’s happening on the ground by looking at our Network Congestion Map, which tracks the flow of goods across different regions. The map is constantly updated with data on cities and states throughout the US, Latin America, and Europe, as well as interstate transit metrics and data on 230 ports around the world.