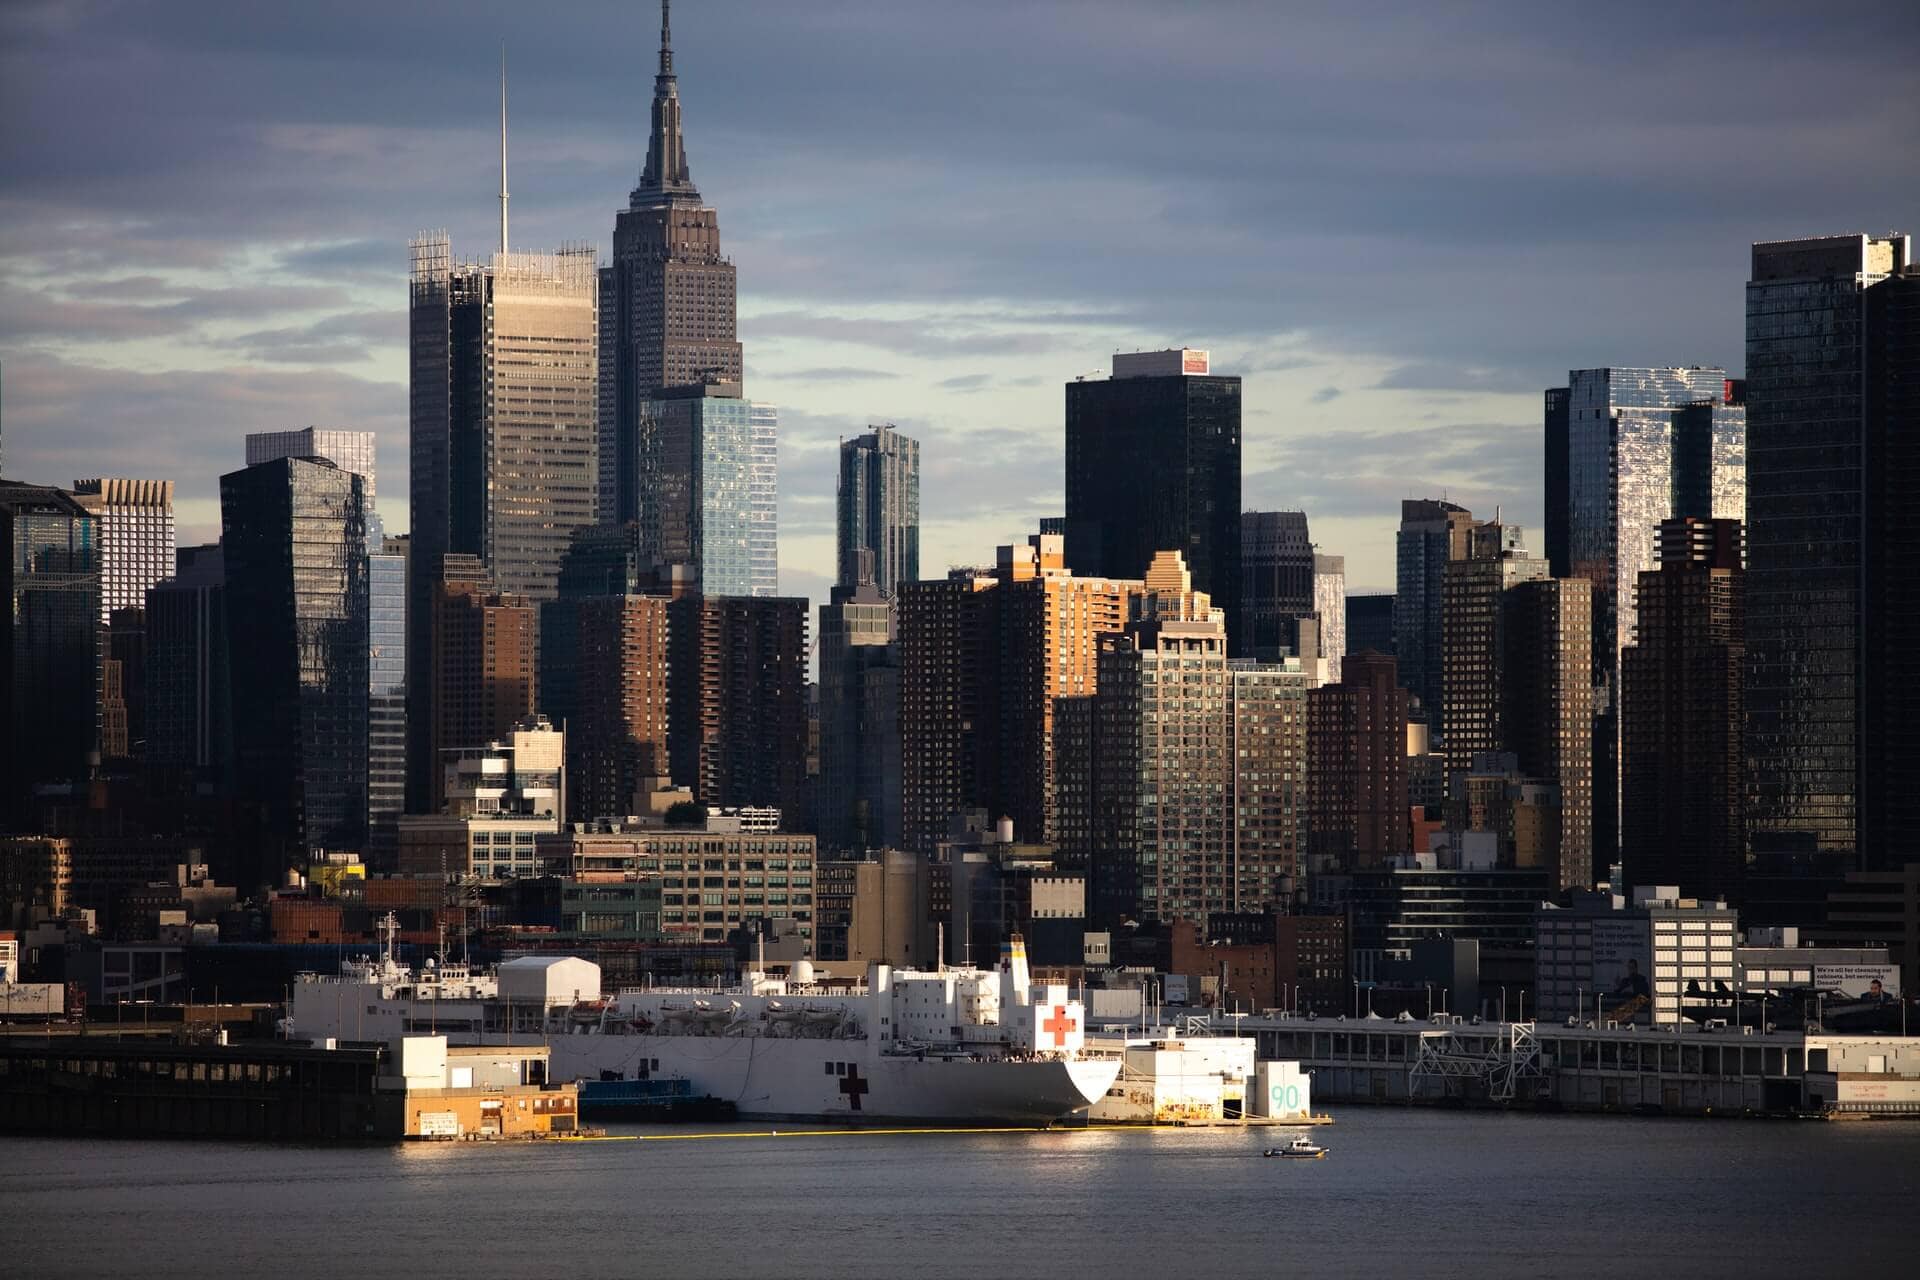
As the COVID-19 health crisis continues to force the supply chain to grapple with unprecedented logistical challenges, no region has been more impacted than New York.
FourKites has been closely following volume trends impacting supply chains in four of the most affected cities: New York, New Orleans, Detroit and San Francisco. While all cities have seen sharp fluctuations in shipment flows since the outbreak of the virus, no city has suffered bigger interruptions than New York. An illustration of this impact is clear by looking at shipments moving into the city and analyzing the various reasons those loads were delayed. We began analyzing these COVID-related Late Reason Codes several weeks ago when we published our research on facility-related delays.
In conducting this city-level comparison of late reason codes, we first turned to extended dwell time delays, or the time spent waiting at facilities for pickups and at intermediate stops.
Between March 1 to March 28, we noticed that trucks transporting goods into New York experienced extended dwell time delays at facilities 68% more frequently than in January and February. By comparison, trucks going into New Orleans, Detroit and San Francisco, in aggregate, saw extended dwell time increase only 36% more frequently than in January and February.
New York’s sheer volume likely worked against it here. As the nation’s largest and densest metropolitan area, any fluctuations in the supply chain were likely magnified disproportionately compared to other metropolitan areas.
FourKites data shows that since March 28, extended dwell percentages for all four cities have retreated to 14.9% above January/February averages, with New York settling back in at 17.3% above average and the remaining three cities at 13.6%.
While operational constraints that caused late loads are trending back to their pre-COVID-19 averages, reentry delays – which refers to when drivers are turned away from the docks and are sent to a waiting area until they can be processed – in the four cities under review continue to be cause for concern. In aggregate, we saw that reentry delays occurred 41% more frequently in March than in January and February.
New York is doing relatively better than the other three cities in this area, with reentry delays at 27% above normal, and the other three cities showing reentry delays occurring nearly 50% more frequently.
As we continue to learn from the experience of New York and other regions during this crisis, one clear takeaway is that companies that are prepared with better data and insights are more adaptable in reacting to these conditions – sometimes hours or days before they occur.
Companies will also need to revisit their contingency plans to make sure they have adequate inventory and flexibility in transportation capacity to handle sharp fluctuations in supply or demand during this global crisis.
In a recent report, for example, Gartner noted that “high-demand product categories have proved vulnerable to insufficient supply during this crisis as shippers suffered from a shortage of freight capacity.” What’s more, Gartner also found that “as capacity declines, shippers have faced both increased volumes of tender rejections as well as increasing rates.”
Indeed, while it’s hard to know exactly when the current pandemic will be finally behind us, it’s clear that domestic freight markets should expect to be under more strain from a surge in inbound traffic as manufacturing in Asia returns to pre-crisis levels.
At FourKites, we continue to analyze data from millions of loads and real-time machine learning to help shippers and carriers optimize their assets and inventory movements. We will continue to provide additional insights, as the impact of COVID-19 on global supply chains unfolds in the weeks ahead.